Download
Step 1. Add the JitPack repository to your build file
Add it in your root settings.gradle at the end of repositories:
	dependencyResolutionManagement {
		repositoriesMode.set(RepositoriesMode.FAIL_ON_PROJECT_REPOS)
		repositories {
			mavenCentral()
			maven { url 'https://jitpack.io' }
		}
	}
Add it in your settings.gradle.kts at the end of repositories:
	dependencyResolutionManagement {
		repositoriesMode.set(RepositoriesMode.FAIL_ON_PROJECT_REPOS)
		repositories {
			mavenCentral()
			maven { url = uri("https://jitpack.io") }
		}
	}
Add to pom.xml
	<repositories>
		<repository>
		    <id>jitpack.io</id>
		    <url>https://jitpack.io</url>
		</repository>
	</repositories>
Add it in your build.sbt at the end of resolvers:
resolvers += "jitpack" at "https://jitpack.io"
Add it in your project.clj at the end of repositories:
:repositories [["jitpack" "https://jitpack.io"]]
Step 2. Add the dependency
	dependencies {
		implementation 'com.github.yuriy-g:simple-java-plot:'
	}
dependencies {
implementation("com.github.yuriy-g:simple-java-plot:")
} <dependency>
<groupId>com.github.yuriy-g</groupId>
<artifactId>simple-java-plot</artifactId>
<version></version>
</dependency>
libraryDependencies += "com.github.yuriy-g" % "simple-java-plot" % ""
:dependencies [[com.github.yuriy-g/simple-java-plot ""]]
Readme
Simple Java Plot
Simple Java implementation of plot. No dependencies besides standard libraries. 1 source file.
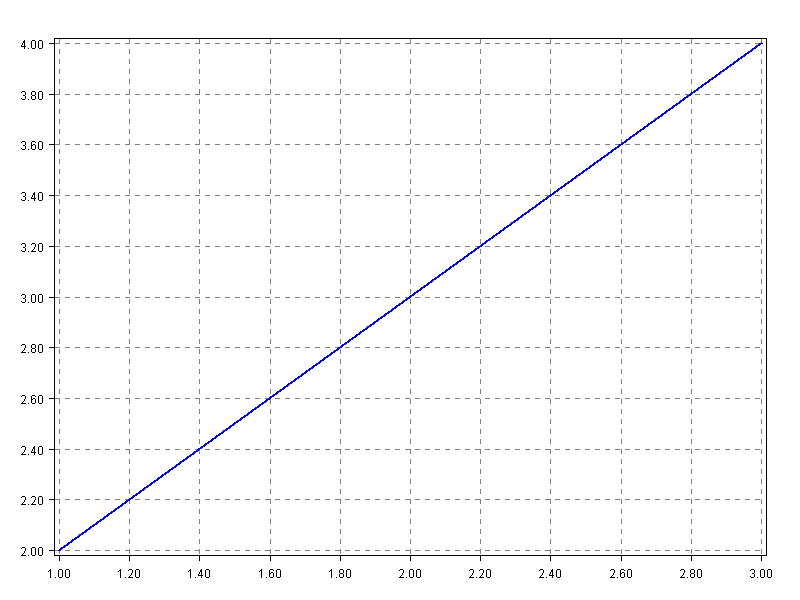
Minimal example:
// configuring everything by default
Plot plot = Plot.plot(null).
	// setting data
	series(null, Plot.data().
		xy(1, 2).
		xy(3, 4), null);

// saving sample_minimal.png
plot.save("sample_minimal", "png");

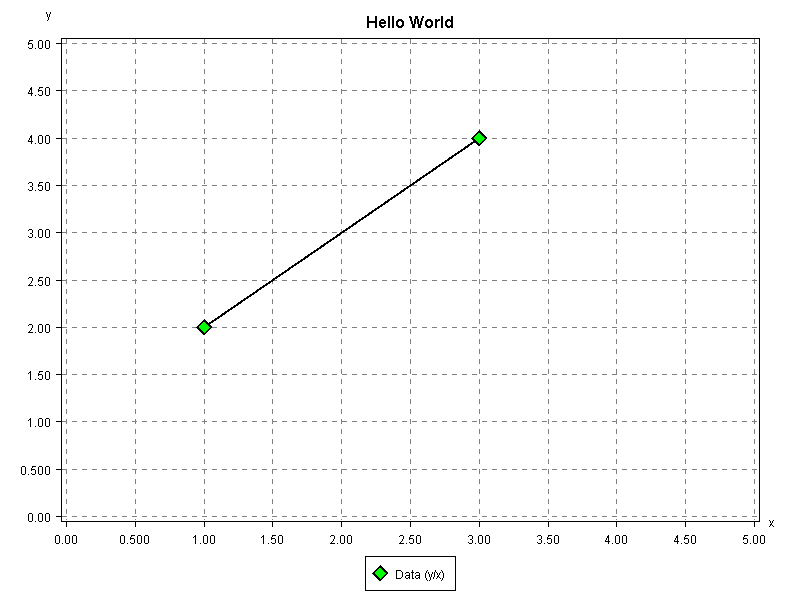
Hello World
Plot plot = Plot.plot(Plot.plotOpts().
		title("Hello World").
		legend(Plot.LegendFormat.BOTTOM)).
	xAxis("x", Plot.axisOpts().
		range(0, 5)).
	yAxis("y", Plot.axisOpts().
		range(0, 5)).
	series("Data", Plot.data().
		xy(1, 2).
		xy(3, 4),
		Plot.seriesOpts().
			marker(Plot.Marker.DIAMOND).
			markerColor(Color.GREEN).
			color(Color.BLACK));

plot.save("sample_hello", "png");
